Curiosity didn't kill the cat. Bad data did.
See the revenue behind any iOS or Google Play app. Every number ships with a P10–P90 range, an A–D grade and its source — in the dashboard, the API, or your AI agent over MCP.
Free plan at launch · 250 credits / month · no card












Every app on the charts in. One honest range out.
Ask in plain language. Get a range, not a guess.
Connect DataPussy to Claude, Cursor or any MCP client: 14 curated tools, and every answer shows its cost.
Your AI agent
Claude · Cursor · any MCP client
You: How much does a top-50 meditation app make in the US?
tool calls · DataPussy MCP
apps_search · category=health-fitness · country=US · rank≤50
apps_get · view=concise · 12 credits
Agent: Here's one from the top 50 — as a range, with its grade and where each input came from.
Example — illustrative, not real dataStillwater: Sleep & Meditation
Health & Fitness · iOS · US
Revenue · 30dmodeledGrade B$2.6MP10 $1.9M–P90 $3.4MEstimate — modeledmethod v0.3
- store chart · observed · 2h
- price · observed
- M3 · modeled
See the app market in the dark
Explore apps, read estimates that show their range, and hear about it when something moves. Every number says whether we observed it or modeled it.


Every number shows its work
Four steps sit behind every revenue and download figure. Follow one example estimate from public signals to a graded range.
- Step 01
Observe
Public signals we collect ourselves
Chart rank, ratings velocity, price and ads, read from the public stores. Every input keeps its source and how old it is.
- Step 02
Model
Rank → downloads → revenue
Chart rank maps to downloads along a power law. Downloads × conversion × price gives revenue. Anything we computed is labeled modeled, with its method version.
- Step 03
Band
P10–P90 around the P50
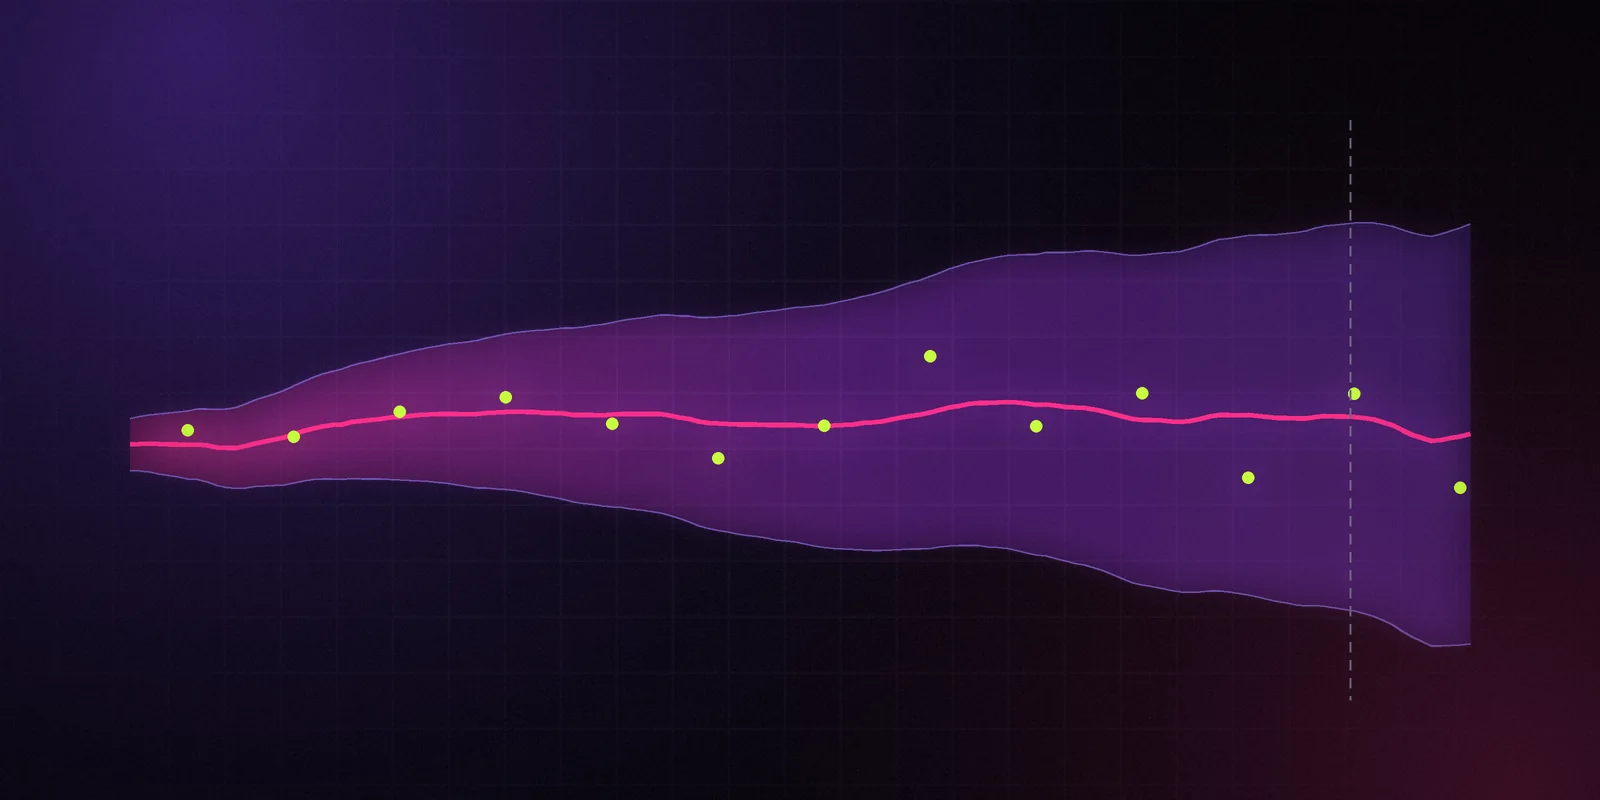
Every estimate ships as a range, not a lone number. The band narrows as observed inputs accumulate, and stays wide when they don’t.
- Step 04
Grade
A–D from inputs and calibration
The grade reflects input coverage and how well the method is calibrated for that kind of app. No ground truth to check against means D. Tiny apps get a band, never a fake exact number.
Built for your code and your agents
A REST API (v1), an MCP server with 14 tools and HMAC-signed webhooks, all on one contract, so the numbers match everywhere. Opens at launch.
REST API v1
Filter with the same grammar as the dashboard. Price any call with dry_run, cap it with max_credits.
curl -X POST "https://api.datapussy.com/v1/apps/search?dry_run=true&max_credits=200" \
  -H "Authorization: Bearer $DATAPUSSY_API_KEY" \
  -d '{
    "filters": {
      "store": "ios",
      "country": "US",
      "category": "health-fitness"
    },
    "view": "concise"
  }'

# response headers
HTTP/1.1 200 OK
X-Credits-Estimated: 50
Signed webhooks
Changes delivered to your endpoint, HMAC-signed per Standard Webhooks and retried. Missed one? Replay it from GET /v1/events.
POST /hooks/datapussy HTTP/1.1
webhook-id: msg_…
webhook-timestamp: 1767225600
webhook-signature: v1,…

{
  "type": "app.rank_changed",
  "app": "ios:…",
  "from": 31,
  "to": 12,
  "country": "US"
}
MCP server, 14 tools
Plug DataPussy into Claude, Cursor or any MCP client. Hand-written tools on the same operations as the API, a concise or a detailed view with P10 and P90 kept in both, and the cost in every answer.
- apps_search
- apps_get
- apps_timeseries
- changes_list
- watchlists_manage
- +9 more
// tool call
{
  "tool": "apps_get",
  "arguments": {
    "id": "ios:…",
    "view": "concise"
  }
}

// result (excerpt)
{
  "downloads_30d": {
    "p10": 340000,
    "p50": 412000,
    "p90": 498000,
    "grade": "B",
    "kind": "modeled",
    "method_version": "v0.3"
  },
  "cost": { "credits": 1 }
}
What every response carries
The same receipts in the API, the MCP server and the webhooks, so a number never travels alone.
- Estimate bandp10 · p50 · p90
- Confidence gradegrade: A–D
- Sourcesource
- Kindobserved | modeled
- Observed atobserved_at
- Method versionmethod_version
- Credits usedcost.credits · X-Credits-*
- Cursor + snapshotcursor · snapshot_id
Code is illustrative: hosts, ids and values are placeholders. Access opens at launch.
A number without a range is a guess with good manners.
Compare approaches, not companies. Every row is something you can check on any estimate you are shown.
| What you can check | DataPussyRange, grade and source | One confident numberA point estimate, no range | Eyeballing the chartsStore ranks and a hunch |
|---|---|---|---|
| P10–P90 range on every number | Yes | No | No |
| A–D confidence grade | Yes | No | No |
| Source and time on every field | Yes | No | YesYou saw it yourself |
| Observed vs modeled, labeled | Yes | NoBlended into one figure | Does not applyNo model, just a hunch |
| Public, versioned method | Yes | Not part of the approachDepends on the provider | Does not applyNothing to publish |
| Tiny apps get a band, not a fake exact figure | Yes | NoExact-looking guess | Does not apply |
| Same numbers in dashboard, API and MCP | Yes | Not part of the approachDepends on the provider | NoNo API for a hunch |
| WaitlistJoin the waitlist |
Built like a cat: sees in the dark, stares back
Most app-intelligence tools hand you one confident number. We hand you the number, how sure we are, and where it came from.
- Night vision
The app market is dark. We read the faint signals — charts, ratings, prices, ads — and show you what moves.
- The stare
We look straight at you, including when we are wrong. Errors get published next to the method that made them.
- Grooming
Clean data, every day. Every field keeps its source, its kind and the time we saw it.
- The tail
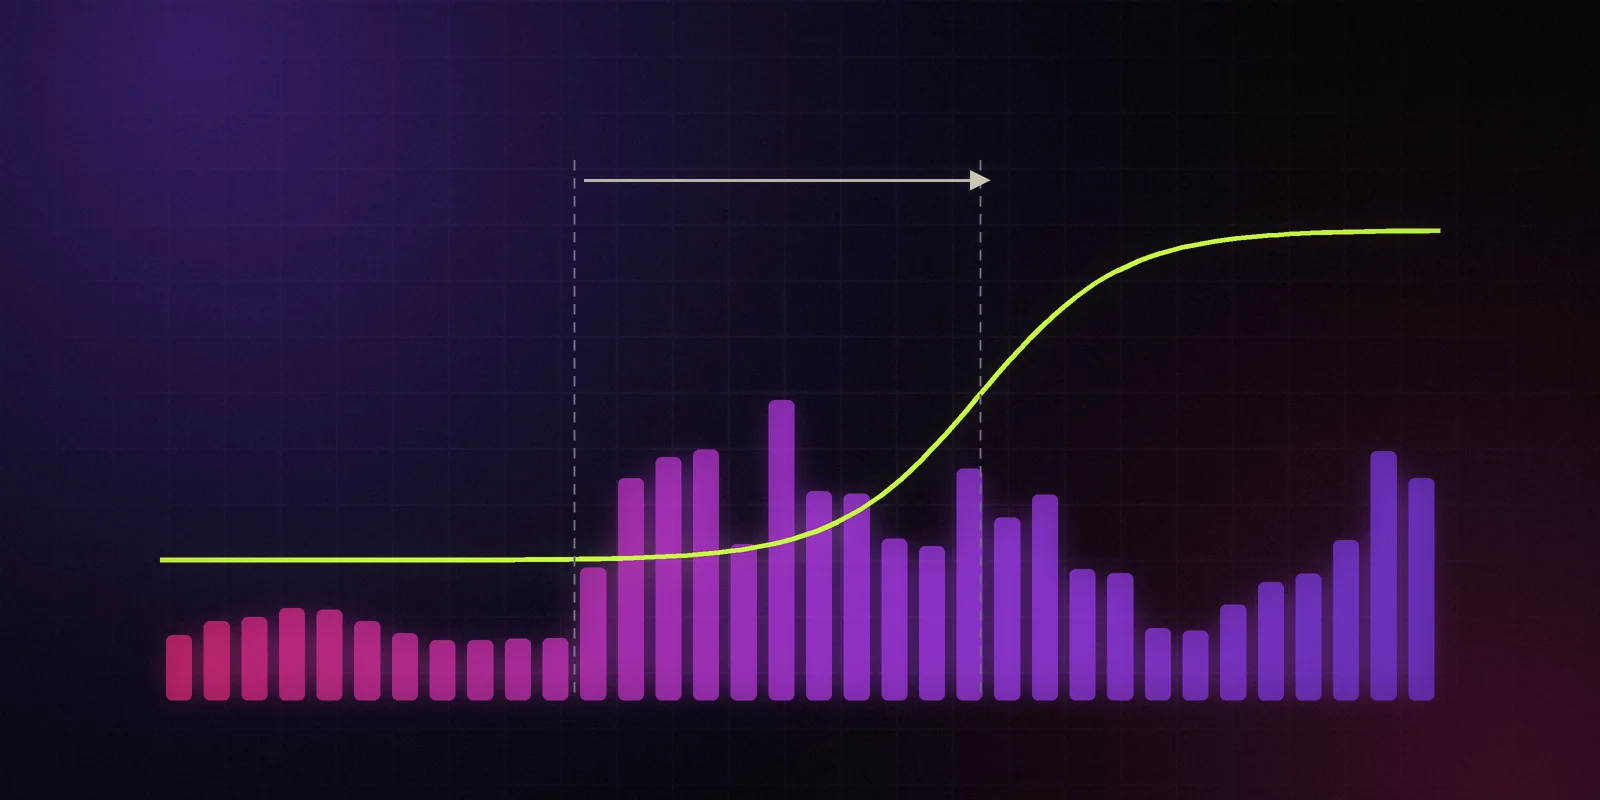
Drawn as the long-tail curve we model: a few apps take most of the downloads, and we say how sure we are about the rest.
One dataset, one chart, one method note. Weekly.
Each Drop asks one question about the app market, shows the band around the answer and lets you download the CSV. The first ones are planned below — they ship with the waitlist.

Start free. Pay when it pays for itself.
Credits are spent by the API and the MCP server. Browsing the dashboard on a paid plan is free.
Free
$0/month
No card required
Kick the tires. No card, no trial clock.
- 250 credits every month
- 1 seat
- 10 requests / minute
- Dashboard, API and MCP
- Every estimate with P10–P90 and a grade
Indie
$29/month
or $290 a year, 2 months free
For the solo developer shipping and watching rivals.
- 3,000 credits every month
- 1 seat
- 60 requests / minute
- Watchlists, email alerts, signed webhooks
- Browsing the dashboard spends no credits
Team
$99/month
or $990 a year, 2 months free
For studios and growth teams that live in the data.
- 15,000 credits every month
- 5 seats
- 300 requests / minute
- Everything in Indie
- Shared watchlists and saved views
Credit packs that never expire: 5k $59 · 25k $225 · 100k $700 · 14-day refund · cancel in two clicks
Questions a skeptic would ask
Good. Ask them. Here are the straight answers.
Still curious?
A person reads every email.

Stop guessing in the dark.
The free plan, the first Data Drops and the private alpha go to the waitlist first.